
SimWrapper version 3.3

SimWrapper minor release 3.3 is out now.
Some bugfixes and a few new features:
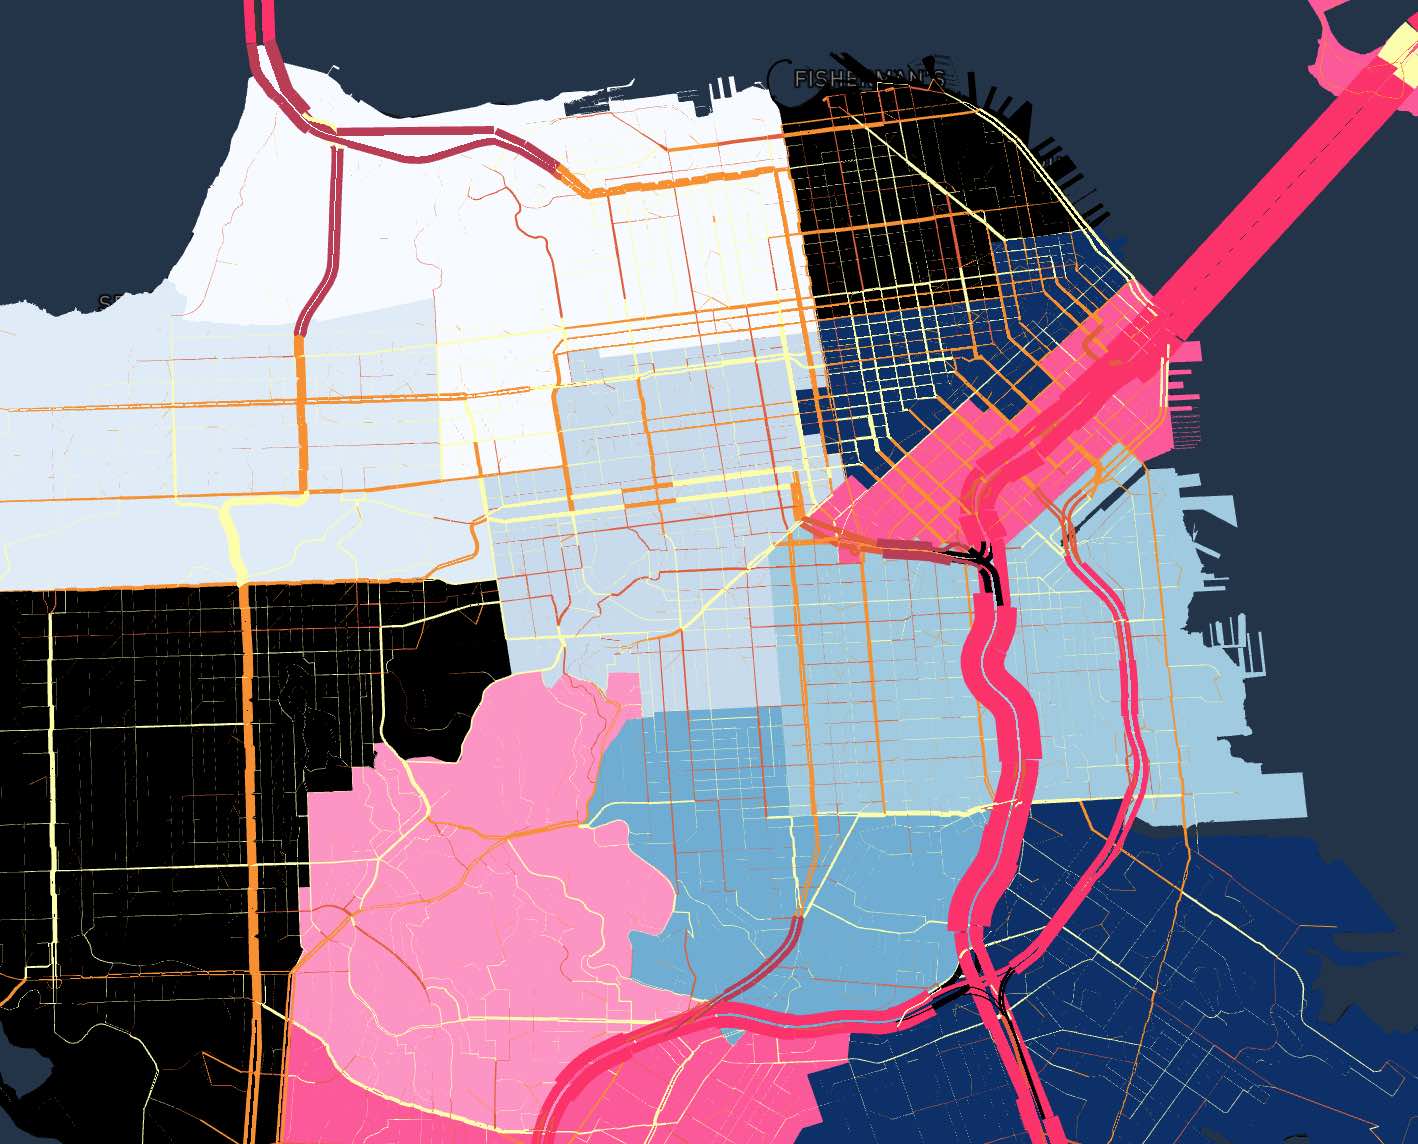
Background layers in Shapefile/GeoJSON viewer. The main Shapefile/Network/GeoJSON map view learned how to draw background polygon layers behind your main dataset. This is useful for delineating geographies such as district boundaries and service areas that are relevant to your dataset.
You can find this feature in the configurator button in the top-right of the map view; open the
Layers section and add your GeoJSON data directly. Note that, due to browser security rules, the
file might not immediately load if it is not stored in the same folder as your model run. You can
edit the path to include a relative path such as ../../boundaries/my_service_area.geojson and
then it will load.
The YAML for the boundary layers is backward-compatible with your existing map YAML configs. There
is a new backgroundLayers section, which looks like below:
title: "My Map with Layers"
description: "Example"
zoom: 11.3
center: -122.4, 37.72
shapes:
    file: freeflow.geojson
    join: AB
datasets: {}
display: {}
# HERE IS THE NEW STUFF --
backgroundLayers:
    Supervisor Districts:
        shapes: ../../shapefiles/SupervisorDistricts.shp
        fill: "Rainbow" # each shape will have a different color
        opacity: 0.3
        borderColor: "#fff"  # CSS color hex codes
        borderWidth: 3
        label: NAME # optional data column with a label for the polygon
        visible: true  # default to showing this layer
    Layer2:
        shapes: ../sf-taz.geojson
        fill: "#fff" #white
        opacity: 0.5
        borderColor: "#fff"
        borderWidth: 1
        visible: false # default to hide this layer; user can click to add it
See the Change Log for the full list of updates.
 Example SimWrapper 2.0 dashboard with link data, x/y/time point data, new navigation, and some charts